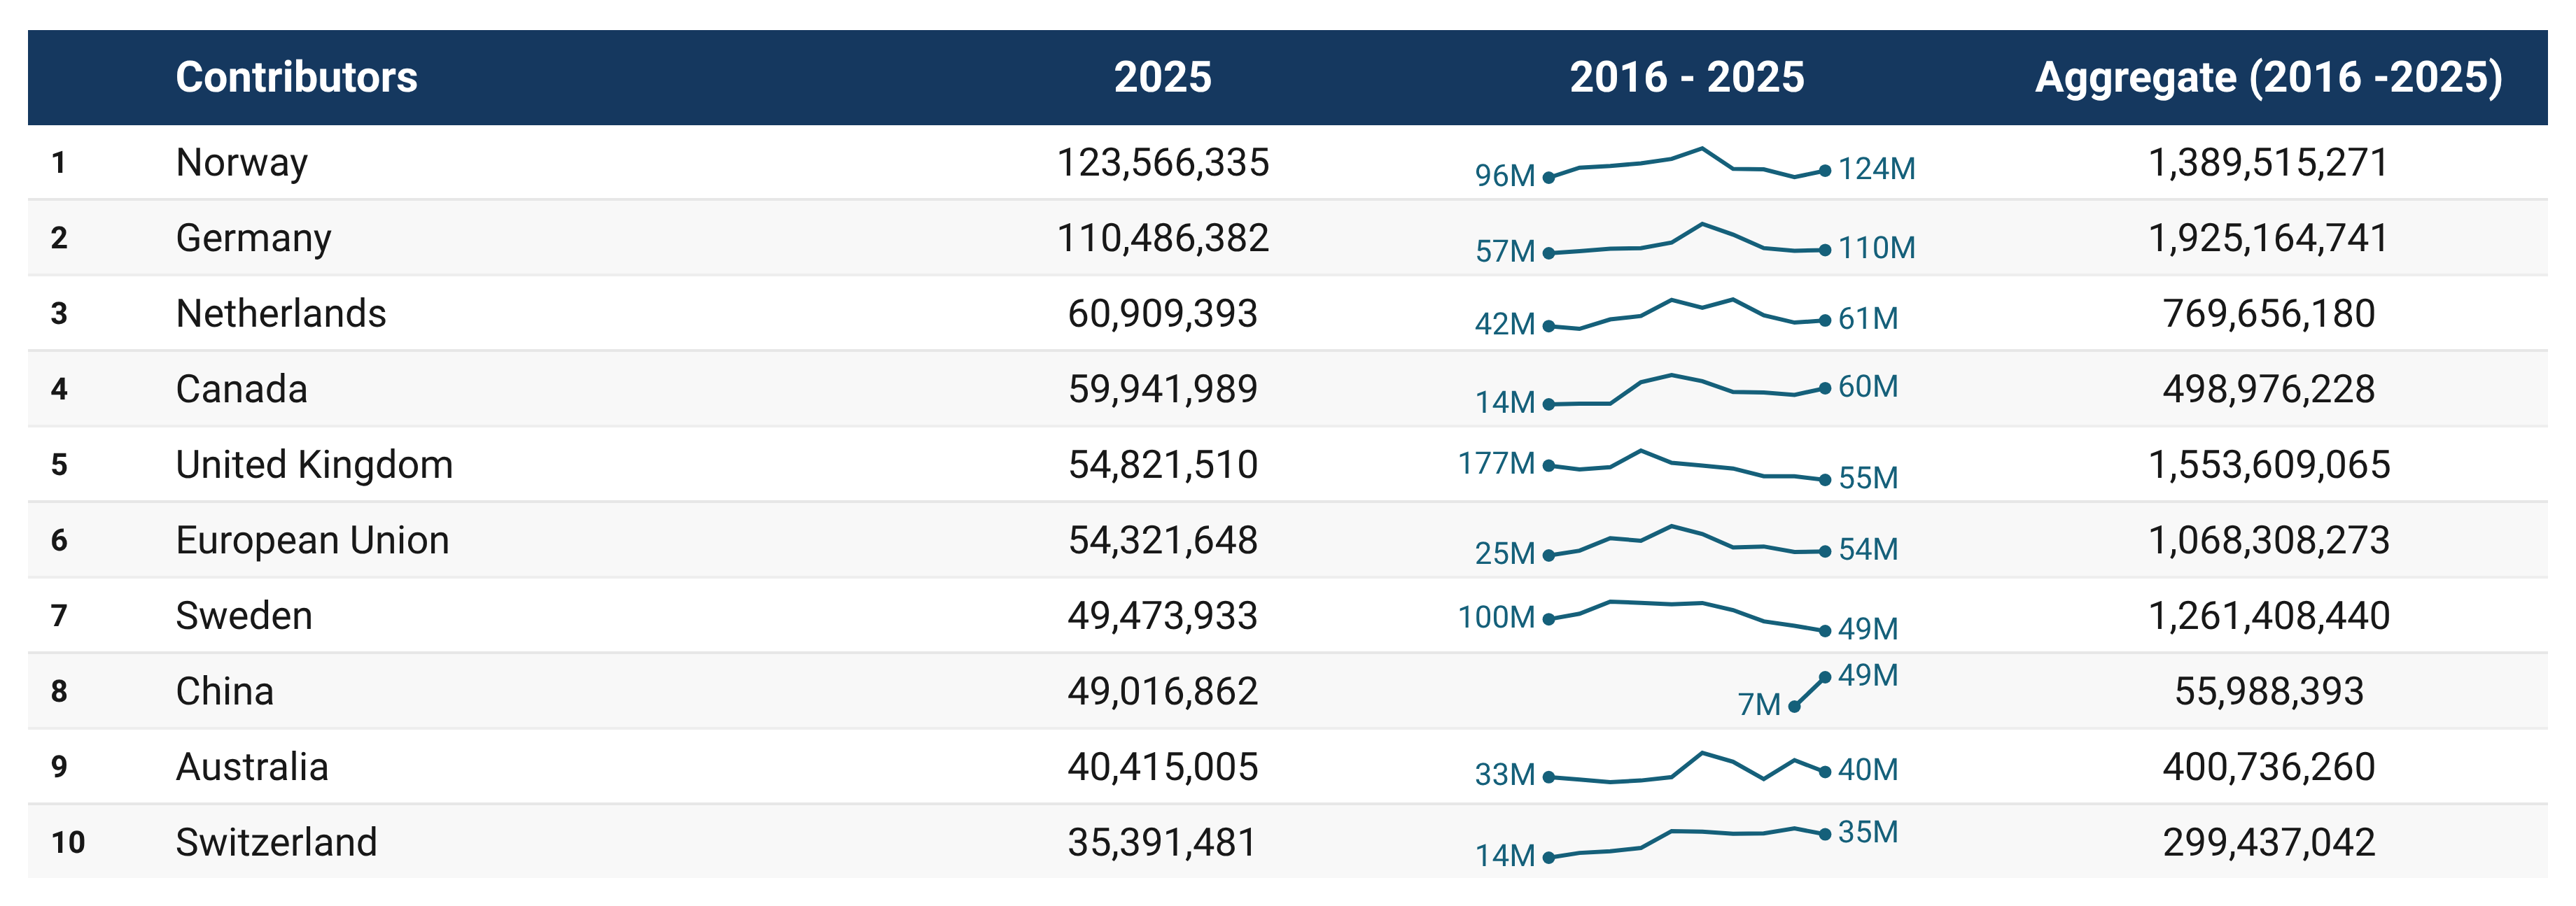
This section takes a deeper look at the MPTFO’s partnerships, including top contributors, participating organizations, and programme countries and regions receiving resources from funds. It also includes an overview of ‘non-traditional’ contributors: where and with whom the Office is expanding its contributor-base.
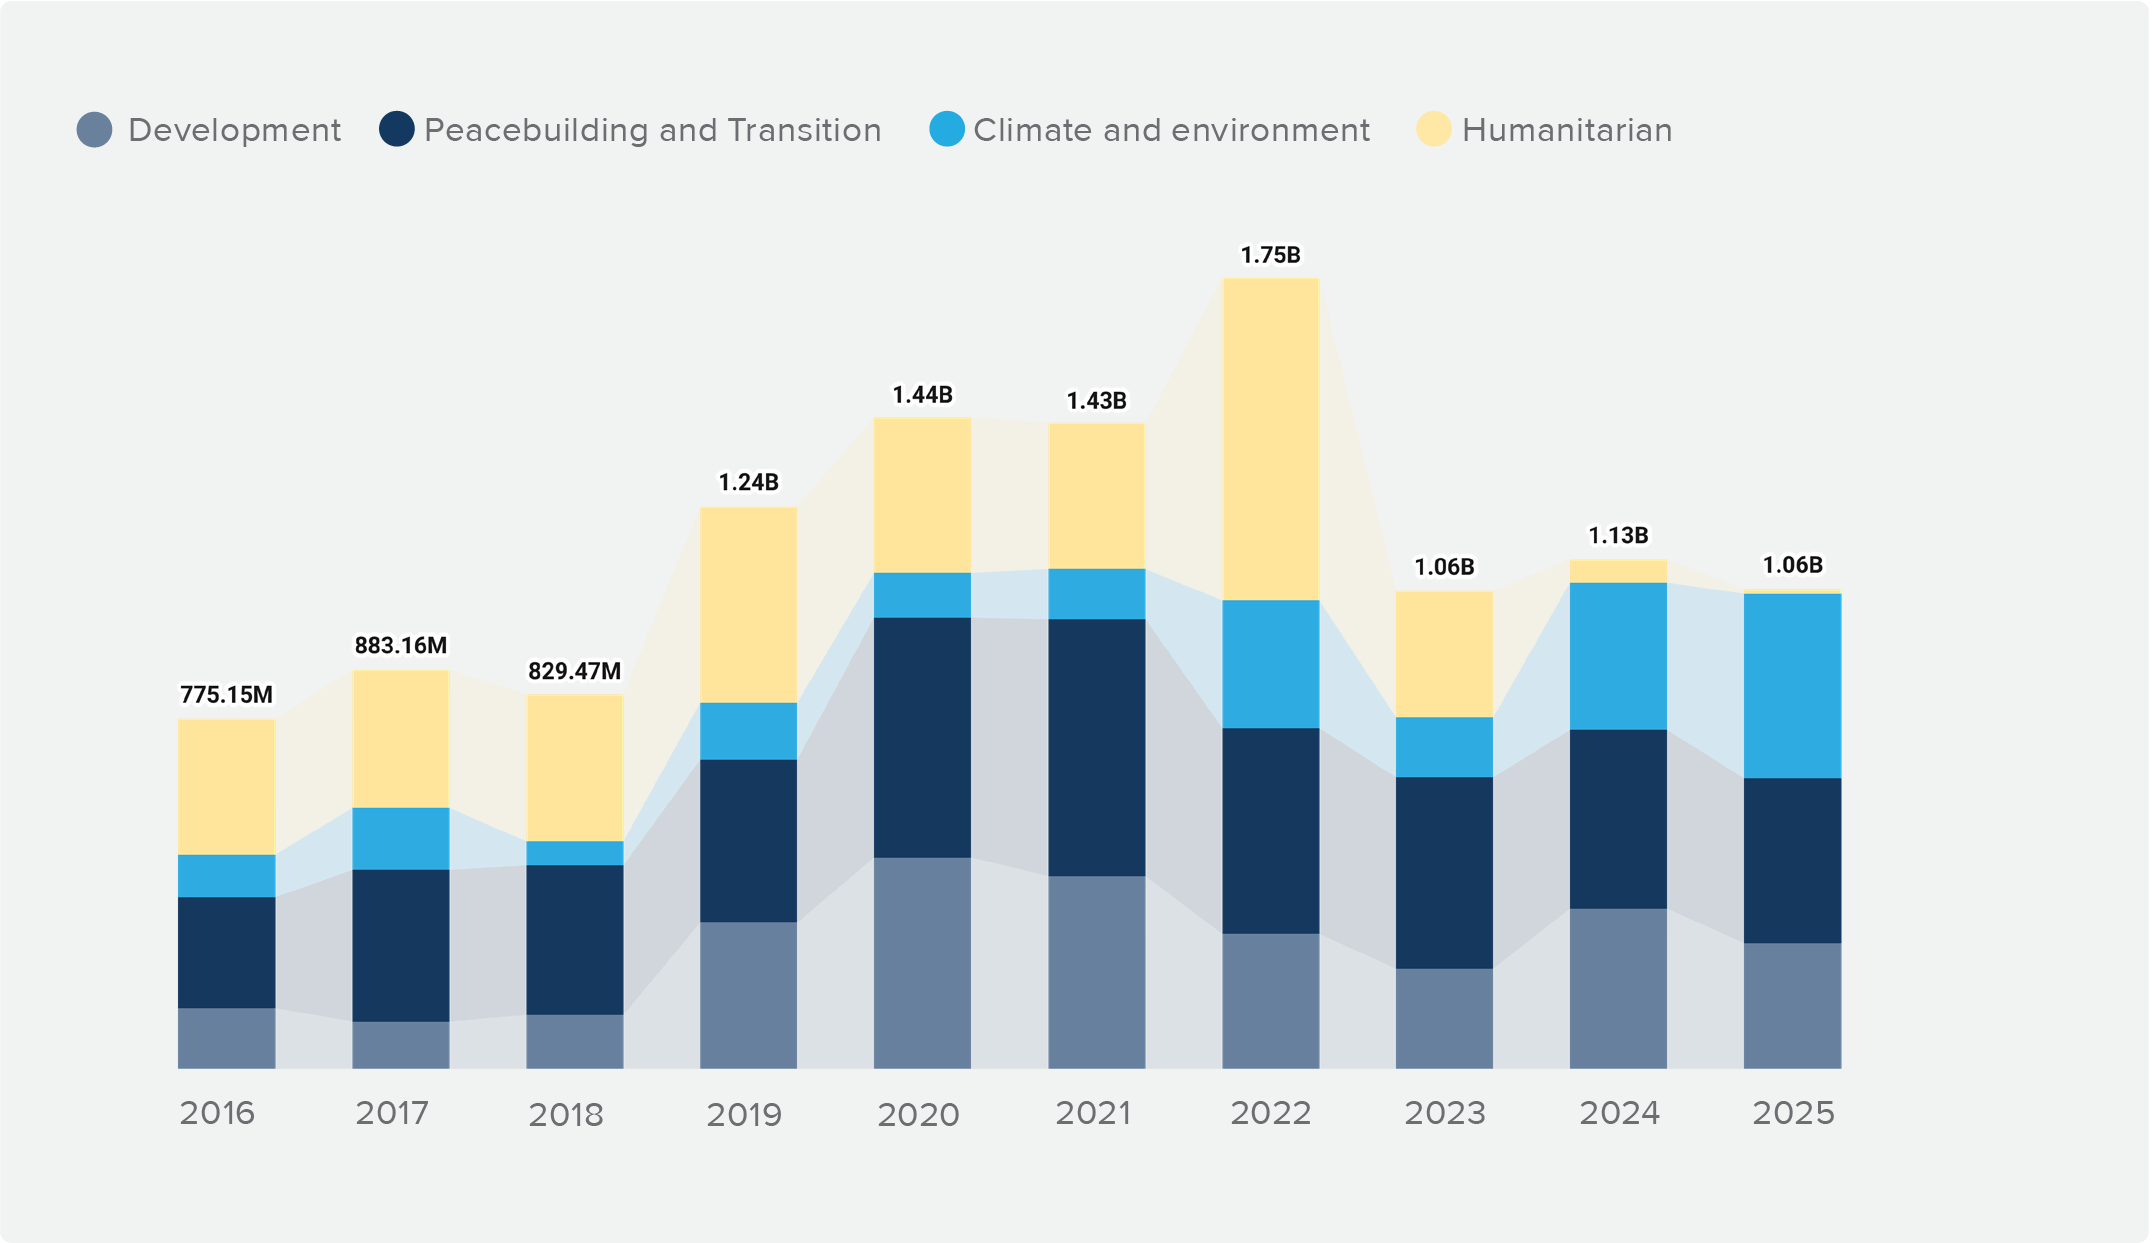
Graph: Transfers from MPTFO-administered funds by thematic scope (US$, 2016-2025)
List of non-traditional contributors to MPTFO-administered pooled funds in 2025 (in US$)
| Name of non-traditional contributors | Deposits | |
|---|---|---|
| 1 | UN Foundtn/UN Partnrshp Office | 11,179,107 |
| 2 | United Nations | 6,000,000 |
| 3 | UN Office for Project Services | 2,950,000 |
| 4 | Cartier Philanthropy | 1,000,000 |
| 5 | United States Fund for UNICEF | 980,000 |
| 6 | Bill and Melinda Gates Foundation | 750,000 |
| 7 | Honda Motor Co. Ltd | 600,000 |
| 8 | Michelin Corporate Foundation | 587,283 |
| 9 | Children’s Investment Fund Foundation | 500,000 |
| 10 | Fondazione Compagnia di San Paolo | 500,000 |
Top 10 programme countries based on transfers from MPTFO-administered funds in 2025 (US$)
| Country | Region | Transfers in 2025 | |
|---|---|---|---|
| 1 | Congo (the Democratic Republic of the) | Africa | 236,694,703 |
| 2 | Afghanistan | Asia | 34,701,973 |
| 3 | Papua New Guinea | Oceania | 33,382,501 |
| 4 | Cameroon | Africa | 31,753,583 |
| 5 | Somalia | Africa | 31,293,471 |
| 6 | Colombia | Americas | 28,783,543 |
| 7 | South Sudan | Africa | 23,166,884 |
| 8 | Uzbekistan | Asia | 22,926,176 |
| 9 | Uganda | Africa | 18,120,646 |
| 10 | Syrian Arab Republic | Asia | 17,174,623 |
| Grand Total | 477,998,105 | ||
The geographic distribution of pooled funds, as illustrated, demonstrates their function as a strategic
tool for allocating resources across multiple regions and contexts: by consolidating contributions around common objectives, these pooled funds advanced equity, efficiency, and collective action globally.
Transfers by region in 2025 (US$).